

This guide provides information about best practices for creating a data visualization, including design tips, design tools, and recommended books.
It is created and monitored by the DHSS Library.
This page contains links to external websites and documents created by outside organizations. Please note these resources may not meet WCAG 2.2 level AA accessibility standards.
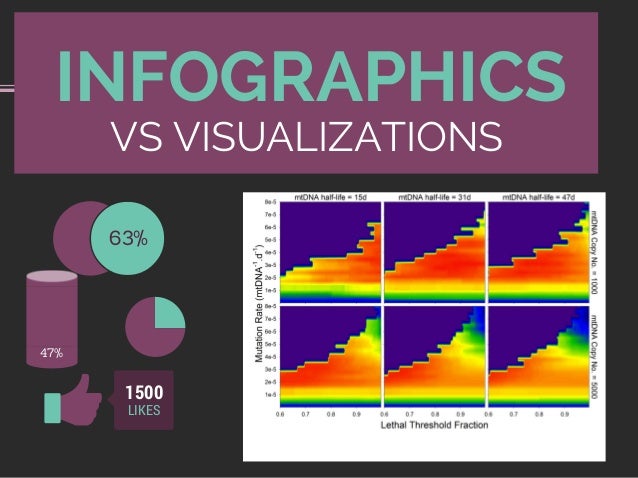
“Information graphics are visual representations of information, data or knowledge often used to support information, strengthen it and present it within a sensitive context….They are specific, context-sensitive and often times hand-crafted. Data visualizations are visual displays of measured quantities by means of the combined use of a coordination system, points, lines, shapes, digits, letters quantified by visual attributes. They are general, context-free and often times created automatically. Both can be static, animated or interactive…So, I think the difference is more about the objective. Information graphics; are used to tell a story or answer a question. Data visualizations are used to let the user find his own story or answer.”
-Benjamin Wiederkehr of Datavisualization.ch
Image retrieved from LinkedIn Slideshare, 2018, Infographics vs. Data Visualization: The Critical Difference

(Credit: Brent Dykes, Forbes "Data Storytelling: The Essential Data Science Skill Everyone Needs")
"Data storytelling is a structured approach for communicating data insights, and it involves combination of three key elements: data, visuals, and narrative. When you combine the right visuals and narrative with the right data, you have a data story that can influence and drive change. "
Steps for Creating a Visualization
(Credit: George Mason University)

1. Know your data & purpose
2. Pick a chart type
3. Choose the software or tool
4. Refine your visualization


 Communicating with Data Visualisation
by
How can you transform a spreadsheet of numbers into a clear, compelling story that your audience will want to pass on? This book is a step-by-step guide (honed through the authors′ Guardian masterclasses, workshops and seminars) to bringing data to life through visualisations, from static charts and maps to interactive infographics and motion graphics.Introducing a four-step framework to creating engaging and innovative visualisations, it helps you to:· Find the human stories in your datasets· Design a visual story that will resonate with your audience· Make a clear, persuasive visual that represents your data truthfully· Refine your work to ensure your visual expresses your story in the best possible way.This book also includes a portfolio of best-practice examples and annotated templates to help you choose the right visual for the right audience, and repurpose your work for different contexts.
Communicating with Data Visualisation
by
How can you transform a spreadsheet of numbers into a clear, compelling story that your audience will want to pass on? This book is a step-by-step guide (honed through the authors′ Guardian masterclasses, workshops and seminars) to bringing data to life through visualisations, from static charts and maps to interactive infographics and motion graphics.Introducing a four-step framework to creating engaging and innovative visualisations, it helps you to:· Find the human stories in your datasets· Design a visual story that will resonate with your audience· Make a clear, persuasive visual that represents your data truthfully· Refine your work to ensure your visual expresses your story in the best possible way.This book also includes a portfolio of best-practice examples and annotated templates to help you choose the right visual for the right audience, and repurpose your work for different contexts.
 Hands-On Data Visualization
by
Tell your story and show it with data, using free and easy-to-learn tools on the web. This introductory book teaches you how to design interactive charts and customized maps for your website, beginning with simple drag-and-drop tools such as Google Sheets, Datawrapper, and Tableau Public. You'll also gradually learn how to edit open source code templates like Chart.js, Highcharts, and Leaflet on GitHub. Hands-On Data Visualization takes you step-by-step through tutorials, real-world examples, and online resources. This practical guide is ideal for students, nonprofit organizations, small business owners, local governments, journalists, academics, and anyone who wants to take data out of spreadsheets and turn it into lively interactive stories. No coding experience is required. Build interactive charts and maps and embed them in your website Understand the principles for designing effective charts and maps Learn key data visualization concepts to help you choose the right tools Convert and transform tabular and spatial data to tell your data story Edit and host Chart.js, Highcharts, and Leaflet map code templates on GitHub Learn how to detect bias in charts and maps produced by others
Hands-On Data Visualization
by
Tell your story and show it with data, using free and easy-to-learn tools on the web. This introductory book teaches you how to design interactive charts and customized maps for your website, beginning with simple drag-and-drop tools such as Google Sheets, Datawrapper, and Tableau Public. You'll also gradually learn how to edit open source code templates like Chart.js, Highcharts, and Leaflet on GitHub. Hands-On Data Visualization takes you step-by-step through tutorials, real-world examples, and online resources. This practical guide is ideal for students, nonprofit organizations, small business owners, local governments, journalists, academics, and anyone who wants to take data out of spreadsheets and turn it into lively interactive stories. No coding experience is required. Build interactive charts and maps and embed them in your website Understand the principles for designing effective charts and maps Learn key data visualization concepts to help you choose the right tools Convert and transform tabular and spatial data to tell your data story Edit and host Chart.js, Highcharts, and Leaflet map code templates on GitHub Learn how to detect bias in charts and maps produced by others
 Health Design Thinking
by
Applying the principles of human-centered design to real-world health care challenges, from drug packaging to early detection of breast cancer.This book makes a case for applying the principles of design thinking to real-world health care challenges. As health care systems around the globe struggle to expand access, improve outcomes, and control costs, Health Design Thinking offers a human-centered approach for designing health care products and services, with examples and case studies that range from drug packaging and exam rooms to internet-connected devices for early detection of breast cancer. Written by leaders in the field-Bon Ku, a physician and founder of the innovative Health Design Lab at Sidney Kimmel Medical College, and Ellen Lupton, an award-winning graphic designer and curator at Cooper Hewitt Smithsonian Design Museum-the book outlines the fundamentals of design thinking and highlights important products, prototypes, and research in health design. Health design thinking uses play and experimentation rather than a rigid methodology. It draws on interviews, observations, diagrams, storytelling, physical models, and role playing; design teams focus not on technology but on problems faced by patients and clinicians. The book's diverse case studies show health design thinking in action. These include the development of PillPack, which frames prescription drug delivery in terms of user experience design; a credit card-size device that allows patients to generate their own electrocardiograms; and improved emergency room signage. Drawings, photographs, storyboards, and other visualizations accompany the case studies. Copublished with Cooper Hewitt, Smithsonian Design Museum
Health Design Thinking
by
Applying the principles of human-centered design to real-world health care challenges, from drug packaging to early detection of breast cancer.This book makes a case for applying the principles of design thinking to real-world health care challenges. As health care systems around the globe struggle to expand access, improve outcomes, and control costs, Health Design Thinking offers a human-centered approach for designing health care products and services, with examples and case studies that range from drug packaging and exam rooms to internet-connected devices for early detection of breast cancer. Written by leaders in the field-Bon Ku, a physician and founder of the innovative Health Design Lab at Sidney Kimmel Medical College, and Ellen Lupton, an award-winning graphic designer and curator at Cooper Hewitt Smithsonian Design Museum-the book outlines the fundamentals of design thinking and highlights important products, prototypes, and research in health design. Health design thinking uses play and experimentation rather than a rigid methodology. It draws on interviews, observations, diagrams, storytelling, physical models, and role playing; design teams focus not on technology but on problems faced by patients and clinicians. The book's diverse case studies show health design thinking in action. These include the development of PillPack, which frames prescription drug delivery in terms of user experience design; a credit card-size device that allows patients to generate their own electrocardiograms; and improved emergency room signage. Drawings, photographs, storyboards, and other visualizations accompany the case studies. Copublished with Cooper Hewitt, Smithsonian Design Museum
 A History of Data Visualization and Graphic Communication
by
A comprehensive history of data visualization--its origins, rise, and effects on the ways we think about and solve problems. With complex information everywhere, graphics have become indispensable to our daily lives. Navigation apps show real-time, interactive traffic data. A color-coded map of exit polls details election balloting down to the county level. Charts communicate stock market trends, government spending, and the dangers of epidemics. A History of Data Visualization and Graphic Communication tells the story of how graphics left the exclusive confines of scientific research and became ubiquitous. As data visualization spread, it changed the way we think. Michael Friendly and Howard Wainer take us back to the beginnings of graphic communication in the mid-seventeenth century, when the Dutch cartographer Michael Florent van Langren created the first chart of statistical data, which showed estimates of the distance from Rome to Toledo. By 1786 William Playfair had invented the line graph and bar chart to explain trade imports and exports. In the nineteenth century, the "golden age" of data display, graphics found new uses in tracking disease outbreaks and understanding social issues. Friendly and Wainer make the case that the explosion in graphical communication both reinforced and was advanced by a cognitive revolution: visual thinking. Across disciplines, people realized that information could be conveyed more effectively by visual displays than by words or tables of numbers. Through stories and illustrations, A History of Data Visualization and Graphic Communication details the 400-year evolution of an intellectual framework that has become essential to both science and society at large.
A History of Data Visualization and Graphic Communication
by
A comprehensive history of data visualization--its origins, rise, and effects on the ways we think about and solve problems. With complex information everywhere, graphics have become indispensable to our daily lives. Navigation apps show real-time, interactive traffic data. A color-coded map of exit polls details election balloting down to the county level. Charts communicate stock market trends, government spending, and the dangers of epidemics. A History of Data Visualization and Graphic Communication tells the story of how graphics left the exclusive confines of scientific research and became ubiquitous. As data visualization spread, it changed the way we think. Michael Friendly and Howard Wainer take us back to the beginnings of graphic communication in the mid-seventeenth century, when the Dutch cartographer Michael Florent van Langren created the first chart of statistical data, which showed estimates of the distance from Rome to Toledo. By 1786 William Playfair had invented the line graph and bar chart to explain trade imports and exports. In the nineteenth century, the "golden age" of data display, graphics found new uses in tracking disease outbreaks and understanding social issues. Friendly and Wainer make the case that the explosion in graphical communication both reinforced and was advanced by a cognitive revolution: visual thinking. Across disciplines, people realized that information could be conveyed more effectively by visual displays than by words or tables of numbers. Through stories and illustrations, A History of Data Visualization and Graphic Communication details the 400-year evolution of an intellectual framework that has become essential to both science and society at large.
 New Playful Data
by
New Playful Data: Graphic Design and Illustration for Infographics features brilliant and illustrative infographic projects from gifted graphic designers, illustrators, artists, and even scientists. Not only do they visualize data in a tangible and memorable way through playful illustrations, but they also provide us with inspiration for balancing colors, words, and images, as well as for distinguishing between primary and secondary information when data is presented alongside pictures. The projects revealed in this volume are divided into three main categories: statistical findings, flow diagrams, and instruction and explanation. Some of the projects illustrate data acquired from rigorous and precise scientific research, while others are the product of designers' imagination and experimentation. It's time to learn to play with data!
New Playful Data
by
New Playful Data: Graphic Design and Illustration for Infographics features brilliant and illustrative infographic projects from gifted graphic designers, illustrators, artists, and even scientists. Not only do they visualize data in a tangible and memorable way through playful illustrations, but they also provide us with inspiration for balancing colors, words, and images, as well as for distinguishing between primary and secondary information when data is presented alongside pictures. The projects revealed in this volume are divided into three main categories: statistical findings, flow diagrams, and instruction and explanation. Some of the projects illustrate data acquired from rigorous and precise scientific research, while others are the product of designers' imagination and experimentation. It's time to learn to play with data!